Sifting Through Sieve Analysis
Exploring the particle size measurement landscape can be challenging and time-consuming. We have created a detailed review of industry-standard methods such as sieve analysis and image analysis, where we contrast the principles of sieve analysis against image analysis. We have selected cutting-edge direct imagining particle size analysers, such as Eyecon2, to explain the fundamentals of image analysis which will give you an appreciation of some of the factors to consider in your choice of particle size distribution (PSD) analysis tools.
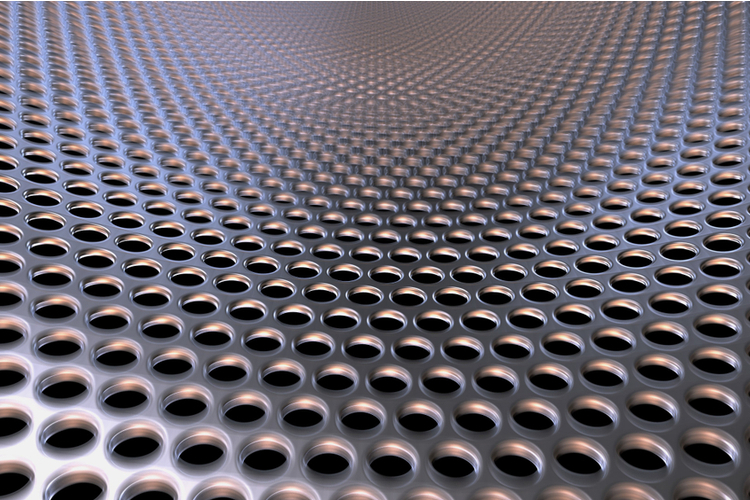
Seen as an industry standard for the measurement of particles, sieve analysis separates fine particles from more coarse particles by passing the material through several sieves of different mesh sizes, as seen in the figure, essentially fractioning particles within certain sieve bin sizes. This mass fraction of particles is measured and weighed to generate a cumulative distribution. There are 2 types of sieve analysis that can be carried out: wet sieving and dry sieving. Wet sieving is suitable for particle sizes from 20μm up to 3mm while dry sieving is suitable for particles from 30μm up to 125mm.
Sieving is often very time consuming and limited to off-line measurement. In contrast, our in-house advanced particle size analyser, Eyecon2 calculates particle size distributions, and shape information based on the measurement of individual particles within a sample image. The images captured are processed by the software EyePASS where the particle detection algorithm identifies and measures individual particles within the image.
Correlation with Particle Properties
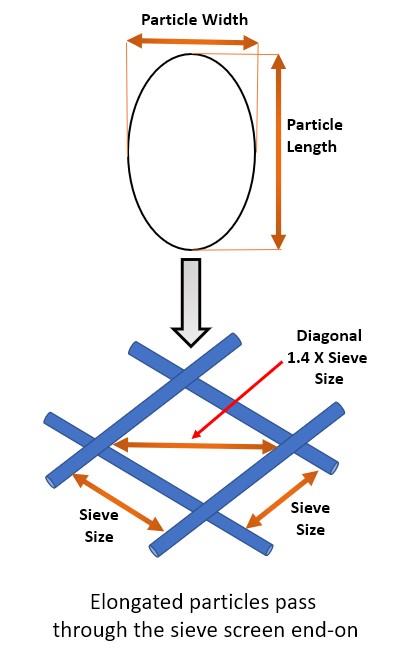
For a sieve tower, the arrangement of the mesh sizes is rarely linearly increasing as this would require an impractically large sieve tower to achieve high accuracy. Determining specific particle sizes with sieve analysis is not possible due to the fact that particles are not measured but instead lay within a particle size range determined by the mesh size of the sieves.
Eyecon2 identifies particles within a sample image which are then processed by EyePASS. EyePASS uses a particle detection algorithm to identify and measure individual particles within the captured image. This approach results in a tighter volume fit than the cubed diameter of an equivalent circle fit used in many other image analysis systems. This allows Eyecon2 to more accurately calculate particle volume, which will affect the subsequently calculated D-Values.
Limitations
While simple in its principle and operation, sieve analysis is not without its limitations of measurement, and the same is true for direct image analysis. The following limitations are applicable to sieve analysis and direct imagining particle size analysers for PSD:
Sieve analysis:
- Sieve analysis will not yield reliable results for elongated and flat particles, and this method does not account for variation in particle shape
- Sieve analysis has longer measurement times and a lower measurement speed than that of laser diffraction or direct imaging
- Lower resolution as particle size range determined by the mesh size of the sieves
- Sieves are prone to blinding. This is the obstruction of the sieve openings by the material that is being analysed
Direct image analysis
- Image analysis methods typically do not test the entire batch, so representative sample extraction is critical
- The focal length of the system may be limited, meaning samples must be adequately close to be measurable
- The measurement system may also be insensitive to very dark, shiny or transparent materials and may lead to an inability to achieve a representative measurement
- Cannot measure particle sizes below 50 µm
For more information, view our detailed application note where we deep dive further into sieve analysis and many more industry-standard PSD measurement methods.
We at Innopharma Technology are motivated to push boundaries in the pharmaceutical industry and share our knowledge. Follow us on LinkedIn and Twitter for more exciting developments from R&D to Pharma 4.0!